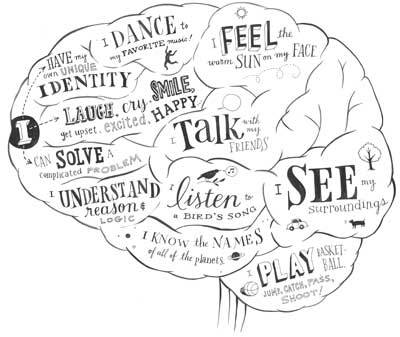
 How I feel about taking this class...well I am little nervous about it. I have never taken an AP class, but I know I can get through this class. But when I took the regular psychology with Mrs. Wollersheim, I loved learning about everything in the class. The bad thing was that it was only one term class. Then when I signed up for this class, I knew there will be a lot of reading...which i'm not really a fast reader. So that means I'll read in advance so I don't forget. The one thing I am mostly scared about this class is the quizzes and the test. In all my life in school, I know that I am not a good test or quiz taker. But I can get better and I just got to study more for them. The topics that I am excited for is The Biology of Mind, Memory, and Psychological Disorders.
Blog #1:
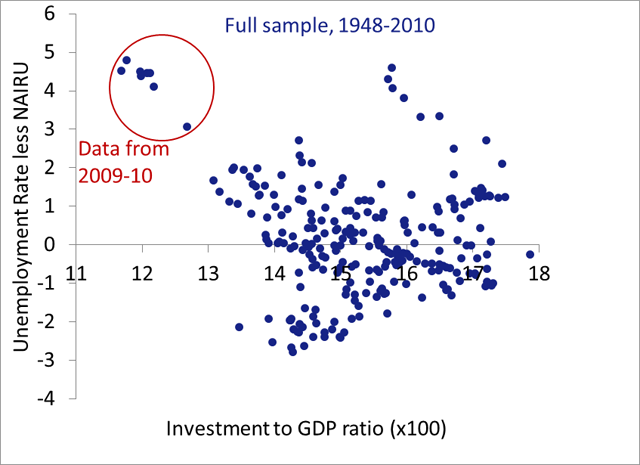
In all the math class that I have taken through high school, we have learned how to make graphs. Sometimes graphing number can be tricky. Within the problem there are all these different numbers that you need to for the x-axes and the y-axes. For the homework assignment for this class we had to make a scatter plot graph and find the direction. On the sheet that we got with students scores from the AP exams, their grade and their ACT scores. At first...I didn't where to begin; then I thought I should take the the score of the AP exams and the ACT composite score and put it one the graph. Whenever Psychologist are doing some experiment or a study, they do this so they can look at their results to see if it was a good experiment or they could think that there is one thing that could be wrong and might have to re calculate.
